

Loading…
Loading…
Loading…
Eduqas GCSE Geography A · C111
Eduqas C111 · 1.2 Methods of Evidence Collection Check the specification (PDF) (opens in a new tab)
A fieldwork enquiry needs evidence that can help answer its question. If you measure a slope, count vehicles or ask people about their local area yourself, you collect primary data. If you use census results, existing weather records or photographs taken by someone else, you use secondary data.
A separate distinction concerns the form of the evidence. Quantitative data consists of numbers: a river's width, a traffic count or a temperature reading. Qualitative data describes features, experiences or opinions: a resident's explanation of why they dislike a street, or an annotated sketch showing damaged buildings.
These categories overlap. A questionnaire you conduct can produce primary quantitative data from a question about the number of journeys someone makes, and primary qualitative data from their explanation of why they travel. Existing numerical weather records are secondary quantitative data.
Accuracy means closeness to the true value. Reliability means consistency when a method is repeated under the same conditions. Neither is automatic: a damaged instrument might repeatedly give the same incorrect reading.
Before fieldwork, check that equipment works, practise using it safely and make sure everyone understands the recording procedure. Record the unit alongside each measurement and keep the procedure consistent between sites. Repeated readings help reveal unusual results, but an unexpected reading should be checked rather than automatically discarded.
For example, when measuring air temperature, allow a digital thermometer to adjust to its surroundings before reading it. Keep its sensor away from your hands and breath, which could warm it. Use a consistent height above the ground and record the reading once it has settled. Record the time as well: a difference between sites could otherwise reflect measurements taken at different times rather than a genuine difference between places.
A clinometer measures an angle of slope in degrees. This is useful when investigating how steepness varies between locations, or how slope might influence runoff and erosion.
Choose two points along the direction of the slope being investigated. Stand at one point and identify a target at the other. The target must be the same height above its local ground as the clinometer is above the ground at your position. This keeps the sight line parallel to the slope between the two points; otherwise, a height difference between observer and target would affect the angle.
Hold the clinometer at eye level and sight towards the target. Keep it steady and wait for its pointer to settle before reading the angle. On a trigger-operated instrument, release the trigger to hold the settled pointer in place. Record the angle in degrees and identify the section measured. Repeat the reading to check consistency.
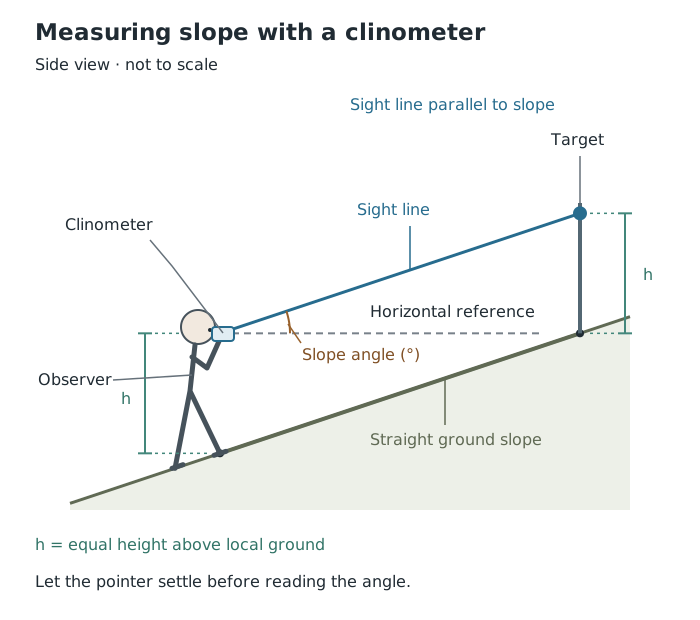
Matching the instrument and target heights allows the clinometer to measure the slope between the two points.
The result represents the slope between the two reference points, not every small change in the ground between them. Where the ground changes steepness, measure separate sections. A walking track may cut across a hillside, so its gradient is not necessarily the gradient of the hillside itself.
Work only on safe, stable ground. Wear suitable footwear, avoid steep or slippery edges, and stop rather than moving to an unsafe position to obtain a reading.
Different enquiries need different kinds of numerical evidence. The important connection is between the question and what the measurement represents.
Flow concerns movement through a place over time. Traffic counts record vehicles passing a point during a stated time interval. River discharge measures the volume of water passing a point per unit of time. Infiltration concerns water entering the ground. A flow result needs a time basis: a count of vehicles without its observation duration cannot fairly be compared with another count.
Scale concerns size or magnitude, rather than map scale in this context. Examples include river width, pebble size and slope gradient. Record what dimension was measured and its unit: a width in metres and an angle in degrees describe different properties.
Spatial pattern concerns variation from place to place. For example, recording retail land use along a street can reveal where different types of shop are concentrated. Measuring sediment size at different locations can reveal sediment sorting. Each observation must remain linked to its location; otherwise, the pattern is lost.
Temporal change concerns variation through time. Repeated records of temperature, rainfall or air pressure can reveal change. Keep the location and measurement procedure consistent, and record dates and times. Moving a thermometer between very different surroundings could make an apparent time trend partly a change of site instead.
Suppose you count traffic at two streets for equal observation periods. Those counts can help compare traffic flow between the streets. Repeating the counts at the same streets later can also help investigate temporal change. Recording both place and time makes the evidence useful for either comparison.
Questionnaires collect information from people using a consistent set of questions. Closed questions offer limited answers, such as a number or a list of options. They make responses easier to compare. Open questions allow people to answer in their own words and can reveal reasons that fixed options miss.
For example, “How did you travel here today?” with stated travel options can produce counts for different modes of transport. “Why did you choose that method?” can provide explanations. Combining the two helps connect a numerical pattern with people's reasons.
Use clear, neutral wording. “How would you describe traffic in this area?” is less leading than “Don't you agree that traffic here is terrible?” Ask the same core questions consistently so that differences in answers are not caused by differences in wording.
Work with your group in a safe public location, away from the road. Approach only people who are comfortable speaking and willing to help. Respect refusals and do not pressure anyone to answer. Record each response before moving on, avoiding duplicate questioning of the same person by different groups.
A bi-polar survey uses opposite descriptions at the ends of a scale. An environmental quality survey might assess cleanliness between “very dirty” and “very clean”, using scores from −3 to +3, with 0 as the middle judgement.
Use several clearly defined indicators, such as cleanliness, noise and building condition. Decide what the positive and negative ends mean before starting, and apply the same direction and criteria at every site. Each site record is complete when every agreed indicator has been scored.
The scores are quantitative, but the judgements behind them are subjective. Two people may disagree about how noisy a street feels. Discussing the criteria beforehand and comparing judgements within a small group can improve consistency. Recording a brief observation alongside a score also makes its basis clearer: “several pieces of litter beside the bus stop” is more informative than a score alone.
Photographs and sketches can record features that a numerical measurement misses. Annotation adds short explanatory notes linked to particular visible features, rather than merely naming them.
For example, an annotation identifying litter beside a bus stop provides evidence relevant to environmental quality. A sketch can simplify a scene so that the features important to the enquiry stand out. Record the location, date and viewing direction so that the evidence can be understood later.
Separate observation from interpretation. Visible litter is an observation; a claim that it results from inadequate bin provision needs supporting evidence. A photograph also shows only what was within the frame at that moment, so it should not automatically be treated as representative of the whole area.
Take photographs from safe positions without stepping into traffic or approaching unstable edges. Respect people's privacy. Before leaving, check that the image or sketch clearly records the intended features and that its identifying details are complete.
Secondary evidence can cover larger areas or longer periods than a school fieldwork visit. It can provide context, allow comparisons or help test whether a short set of primary observations reflects a wider pattern.
Satellite images record the Earth's surface from satellites. They can show land use, including the locations of farms, towns and forests. Comparing images of the same area from different dates can reveal change: for example, the advance or retreat of ice cover. Start by checking the dates and geographical coverage, then identify features that can be compared across the images. Keep differences in viewing conditions in mind before interpreting an apparent difference as real change.
Aerial photographs are taken from aircraft. In a vertical photograph, the camera points straight down, producing a plan-like view useful for examining land use and the arrangement of features. In an oblique photograph, the camera points at an angle, often towards a particular building or site. This angled view highlights relief, such as raised earthworks, making the shape and height of features easier to recognise.
The viewing angle also affects measurement. Features nearer the camera appear at a larger scale than those further away, and parallel lines can appear to converge. This tilt distortion is greater in oblique photographs, so distances and areas cannot be measured accurately from them directly. Vertical photographs are better suited to mapping, but they can also contain distortion, especially towards their edges. Accurate mapping requires rectification: correcting the image's distortion to align it with a map.
Large statistical databases, such as National Statistics, provide existing numerical evidence. Census information can help place local questionnaire findings in a wider population context. Check the geographical area and date represented: statistics for an entire district may not describe a single street accurately.
A Geographic Information System (GIS) is a computer system for capturing, storing, checking and displaying information linked to positions on the Earth's surface. Location is the connection between different datasets. A GIS can overlay them as layers on one map, allowing you to investigate spatial relationships.
For example, a layer showing pollution sources, such as factories, can be compared with layers showing rivers and wetlands. Their locations help identify where water supplies might be at risk. The overlap suggests a relationship to investigate; it does not by itself prove that pollution has occurred. Old or inaccurate information can also make the GIS result misleading.
The Environment Agency provides flood-risk datasets for England that can be loaded into GIS. Its rivers and sea data show areas in four likelihood bands, taking account of the presence and condition of flood defences:
To interpret such a map, first read the key and check the type of flooding represented. Locate the enquiry site, identify its likelihood band, and check the dataset's date, scale and explanation. Suppose a proposed fieldwork site lies within a high-risk area. You could conclude that the surrounding area is mapped as having more than a 3.3% yearly chance of flooding from rivers or the sea. You could not conclude that it flooded during your visit or that a particular building will flood. These datasets indicate likelihood around an area, not the actual impact on an individual property.
This reading routine transfers to authentic GIS maps: identify the location, read the layer's key and use its stated meaning and limitations. Colours alone do not establish the conclusion, and long-term flood-risk information does not replace a fieldwork risk assessment or checks on current conditions.
Primary evidence can be tailored to your enquiry, and you know how it was collected. However, collecting it takes time and may require equipment; a short visit may capture only temporary conditions. Secondary evidence can be quick to access and offer much wider coverage, but its date, methods or geographical boundaries may not match your question.
Using both can strengthen an enquiry. A traffic count describes what happened during your observation period; questionnaire explanations can help interpret travel choices; existing statistics can place those findings in a wider context. Agreement increases confidence, while disagreement is a reason to examine differences in time, place and method rather than simply choosing the result you prefer.
These distinctions overlap: a questionnaire can produce both quantitative and qualitative primary data.
Explain how a precaution improves the result: matching the height of the clinometer and target prevents differences in their height from distorting the slope reading.
Distinguish accuracy from reliability. Repeated readings can agree even when an instrument is faulty.
Primary/secondary describes who collected the evidence; quantitative/qualitative describes its form. These are different distinctions.
A bi-polar survey produces numerical scores, but those scores still depend on people's judgements.
When evaluating secondary evidence, link its date, geographical coverage or collection method to your enquiry rather than simply calling it unreliable.
Describe a safety precaution and the hazard it reduces, rather than just saying that fieldwork should be safe.
It can see this note and what your specification asks for.
Answers are free with an account.
1 free note left this week
Get more free notesYour answer sets when this note comes back for review, or marks it complete.
Was this note helpful?
Log in to tell us whether it helped, or to report a problem.
Last updated
Primary data
Evidence collected first-hand by the person or group carrying out an enquiry.
Secondary data
Evidence collected by someone else and then used in an enquiry.
Quantitative data
Data expressed as numbers, such as measurements, counts or scores.
Qualitative data
Descriptive evidence, such as people's explanations or annotations of landscape features.
Accuracy
How close a measurement is to the true value.
Reliability
How consistently a method produces similar results when repeated under the same conditions.
Clinometer
An instrument used to measure an angle of slope, usually in degrees.
Bi-polar scale
A survey scale with opposing descriptions at its ends, used to score a characteristic or opinion.
Subjectivity
A judgement influenced by a person's opinions rather than based entirely on objective measurement.
Geographic Information System (GIS)
A computer system used to capture, store, check, display and analyse data linked to geographical locations.
Put your knowledge into practice — try past paper questions for Geography A
Primary data
Evidence collected first-hand by the person or group carrying out an enquiry.
Secondary data
Evidence collected by someone else and then used in an enquiry.
Quantitative data
Data expressed as numbers, such as measurements, counts or scores.
Qualitative data
Descriptive evidence, such as people's explanations or annotations of landscape features.
Accuracy
How close a measurement is to the true value.
Reliability
How consistently a method produces similar results when repeated under the same conditions.
Clinometer
An instrument used to measure an angle of slope, usually in degrees.
Bi-polar scale
A survey scale with opposing descriptions at its ends, used to score a characteristic or opinion.
Subjectivity
A judgement influenced by a person's opinions rather than based entirely on objective measurement.
Geographic Information System (GIS)
A computer system used to capture, store, check, display and analyse data linked to geographical locations.
Check date, location, coverage, scale, collection method and relevance. Combine secondary context with primary observations without assuming either is automatically more reliable.