

Loading…
Loading…
Loading…
AQA GCSE Statistics · 8382
AQA 8382 · 3.5.29 Check the specification (PDF) (opens in a new tab)
A machine filling packets cannot put exactly the same mass into every packet. Some variation is expected, but packets should not differ too much from their intended mass. monitors production so that problems can be detected and corrected.
Samples are taken at regular intervals. A statistic, such as the sample mean, median or range, is calculated for each sample. The mean and median help monitor the typical value; the range helps monitor how much individual items differ.
A control chart plots these statistics in the order the samples were taken. Its horizontal axis shows sample number or time, and its vertical axis shows the statistic being monitored, with its units. Horizontal lines show the target and the limits used to decide whether a result needs attention.
For a sample-mean chart, the central line represents the target mean. Above and below it are two warning lines, with two action lines further out.
| Position of a sample statistic | Interpretation and response |
|---|---|
| Between the warning lines | The result is consistent with normal variation. Continue routine sampling. |
| Beyond a warning line, but not beyond the corresponding action line | There may be a problem. Take another sample immediately to check. |
| Beyond either action line | The result is highly unusual for a correctly functioning process. Stop production, investigate and correct or reset the machinery. |
Both directions matter. An unusually low sample mean might indicate underfilled packets; an unusually high one might indicate overfilling. The chart detects departures from the target rather than checking only whether products contain enough.
Repeated samples produce a collection of sample means. These means have their own distribution and standard deviation: this describes how much the means vary, rather than how much individual items vary.
Let be the target mean and be the standard deviation of the sample means. The limits are:
The minus sign gives the lower limit and the plus sign gives the upper limit.
When sample means follow a Normal distribution, approximately 95% lie within two standard deviations of the mean. Consequently, even a correctly functioning process produces about one sample mean in twenty outside the warning limits. A warning is therefore a reason to check, not proof that the machinery is faulty.
Values more than three standard deviations from the mean are highly unusual. Almost all sample means should lie within the action limits when the process is working correctly, so a result beyond them calls for a stronger response.
Suppose a packet-filling process has a target sample mean of 500 g. When it is working correctly, sample means are Normally distributed with a standard deviation of 2 g.
The warning limits are g and g. The action limits are g and g. Draw each limit as a horizontal line across the chart.
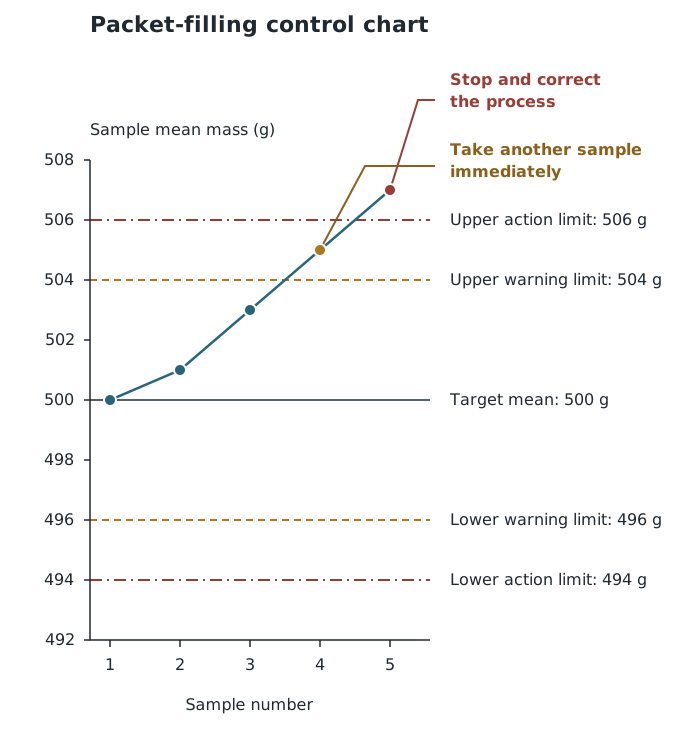
With a target of 500 g and a standard deviation of sample means of 2 g, sample 4 triggers an immediate check and sample 5 triggers corrective action.
The first three sample means, 500 g, 501 g and 503 g, are within the warning limits. They require no change to the routine sampling schedule.
Sample 4 has a mean of 505 g. It lies above the upper warning line but below the upper action line, so another sample should be taken immediately. If that next sample has a mean of 507 g, as sample 5 does here, it is above the upper action line. Production should be stopped and the filling machinery checked and corrected.
Notice that the decision depends on the sample mean, not on the sample number or the steepness of the line joining the points.
A mean close to the target can conceal large differences between items. For example, two packets weighing 498 g and 502 g have a mean of 500 g and a range of 4 g. Two packets weighing 490 g and 510 g also have a mean of 500 g, but their range is 20 g. The low and high measurements balance in the mean, while the range reveals their spread.
A sample-range chart therefore provides a different check. Usually only upper warning and action lines are shown: the concern is that the variation becomes too large. An ideal range of zero would mean every item had the same measurement.
For example, if a question gives an upper range action limit of 12 g, the 20 g range is beyond it. Production should be stopped and corrected even though the sample mean is exactly on target.
For charts monitoring sample medians or ranges, use the limits supplied in the question. Apply the same warning-versus-action distinction, and consider all the charts before deciding what the manufacturer should do.
= target mean; = standard deviation of the sample means.
For Normally distributed sample means, about 95% fall within warning limits. Almost all fall within action limits. A warning can occur through random variation; an action-limit breach is highly unusual.
Mean or median charts monitor the typical value. Range charts monitor variation and usually have only upper limits.
A satisfactory mean can hide an excessive range. Use the supplied limits for median and range charts, and check every chart before deciding on a response.
Use the standard deviation of the sample means, not the standard deviation of individual items, when calculating limits for a sample-mean chart.
State both the position of the plotted value and the response: beyond a warning line means take another sample immediately; beyond an action line means stop and investigate or reset the process.
Check every chart provided. An acceptable sample mean does not guarantee an acceptable sample range.
Draw calculated limits as horizontal lines and label them clearly, including units on the vertical axis.
It can see this note and what your specification asks for.
Answers are free with an account.
1 free note left this week
Get more free notesYour answer sets when this note comes back for review, or marks it complete.
Was this note helpful?
Log in to tell us whether it helped, or to report a problem.
Last updated
Quality assurance
Monitoring a production process to check that manufactured products meet required standards.
Control chart
A time-series chart showing a statistic from successive samples, together with limits used to decide whether the production process needs checking or correcting.
Target value
The intended value for the measurement or statistic being monitored.
Warning line
A horizontal control-chart line marking a limit beyond which another sample should be taken immediately. For a sample-mean chart, warning limits are , where is the standard deviation of the sample means.
Action line
A horizontal control-chart line marking a limit beyond which the production process should be stopped and corrected. For a sample-mean chart, action limits are , where is the standard deviation of the sample means.
Sample range
The difference between the largest and smallest measurements in a sample.
Put your knowledge into practice — try past paper questions for Statistics
Quality assurance
Monitoring a production process to check that manufactured products meet required standards.
Control chart
A time-series chart showing a statistic from successive samples, together with limits used to decide whether the production process needs checking or correcting.
Target value
The intended value for the measurement or statistic being monitored.
Warning line
A horizontal control-chart line marking a limit beyond which another sample should be taken immediately. For a sample-mean chart, warning limits are , where is the standard deviation of the sample means.
Action line
A horizontal control-chart line marking a limit beyond which the production process should be stopped and corrected. For a sample-mean chart, action limits are , where is the standard deviation of the sample means.
Sample range
The difference between the largest and smallest measurements in a sample.