

Loading…
Loading…
Loading…
AQA GCSE Statistics · 8382
AQA 8382 · 3.5.27 Check the specification (PDF) (opens in a new tab)
A Normal distribution is a continuous probability distribution with a symmetric, bell-shaped curve. It can model measurements such as heights or masses when their distribution has this shape. Continuous measurements can take any value within a range, even if we record them rounded to a particular accuracy.
Imagine a histogram of measurements with most values clustered around the middle and fewer values towards either extreme. A Normal curve provides a smooth model of this pattern. It describes the overall distribution rather than tracing every irregularity in a sample.
A Normal curve has one peak at its centre. Moving away from the centre in either direction, the curve becomes lower: values far from the centre are less common than values close to it.
The two sides are mirror images. This symmetry means that equally sized intervals at equal distances on opposite sides of the centre contain equal proportions of values. Half the values lie below the centre and half lie above it.
For an exact Normal distribution, the mean, median and mode are all equal:
A symmetric shape alone is not enough to identify a Normal distribution: it must also have the characteristic single-peaked bell shape.
The mean determines the horizontal position of the centre. Increasing the mean while keeping the spread unchanged shifts the curve to the right without changing its shape.
The standard deviation measures spread around the mean. A small standard deviation produces a narrow, tall curve, because values are closely clustered. A larger standard deviation produces a wider, lower curve, because values are more spread out. If the mean stays unchanged, both curves remain centred at the same value.
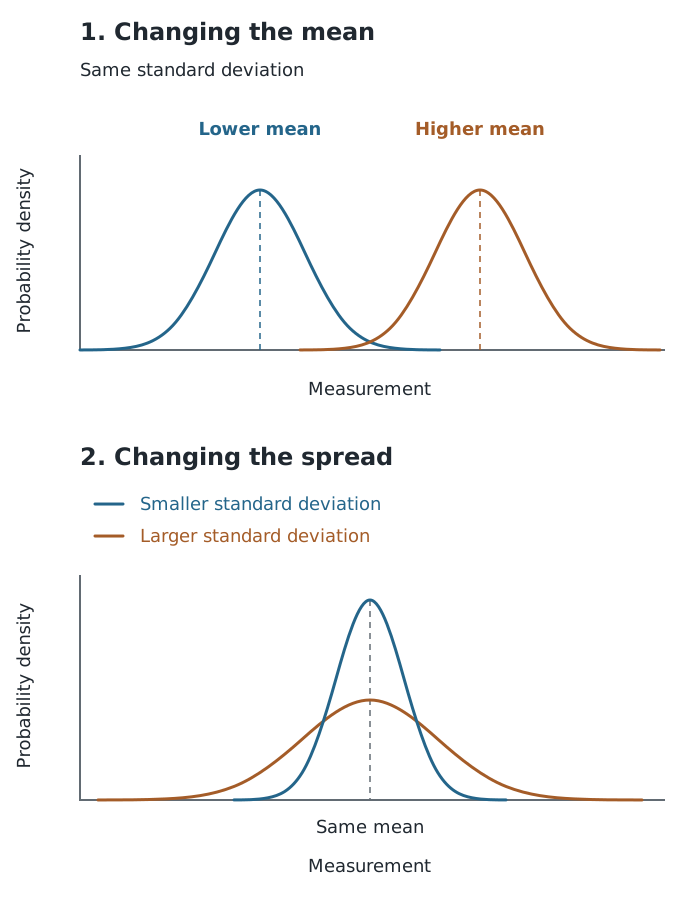
The mean locates the centre; the standard deviation controls the spread.
For example, suppose two machines fill bottles with a mean volume of 500 ml. One machine has a standard deviation of 2 ml and the other has a standard deviation of 4 ml, with both distributions modelled as Normal. Their curves have the same centre, but the first is narrower: its fill volumes are more consistent. Its taller peak does not mean that its average fill volume is greater.
A Normal distribution can be written as , where is the mean and is the variance.
Variance is the standard deviation squared. The mean and standard deviation use the same units as the measurements; variance uses squared units. The notation therefore identifies both the centre and the spread of the distribution.
To judge whether a Normal model is reasonable, consider the measurements and their overall pattern. The data should be continuous, with a roughly symmetric, bell-shaped distribution and most values near the middle. The sample mean, median and mode should be approximately equal.
Real samples will not usually form a perfectly smooth bell shape or have exactly equal averages. Look for the overall pattern rather than expecting perfection. A clearly skewed distribution, with a much longer tail on one side, is not well represented by a Normal model.
: mean , variance , standard deviation .
A suitable model needs continuous data with an approximately symmetric bell shape and approximately equal mean, median and mode. Clearly skewed data are unsuitable.
Identify a Normal distribution using both symmetry and a bell shape; symmetry alone is not enough.
Read the mean from the horizontal position of the centre, not from the height of the peak.
When comparing spread, a wider Normal curve has a larger standard deviation. Compare curves drawn on the same scales.
In N(μ, σ²), the second value is the variance, not the standard deviation.
It can see this note and what your specification asks for.
Answers are free with an account.
1 free note left this week
Get more free notesYour answer sets when this note comes back for review, or marks it complete.
Was this note helpful?
Log in to tell us whether it helped, or to report a problem.
Last updated
Normal distribution
A continuous probability distribution with a symmetric, bell-shaped curve in which the mean, median and mode are equal.
Continuous data
Data representing measurements that can take any value within a range, such as height or mass.
Symmetry
A property of a distribution whose two sides are mirror images about its centre.
Standard deviation
A measure of how spread out values are around the mean. A larger standard deviation means greater spread.
Variance
A measure of spread equal to the square of the standard deviation: .
Put your knowledge into practice — try past paper questions for Statistics
Normal distribution
A continuous probability distribution with a symmetric, bell-shaped curve in which the mean, median and mode are equal.
Continuous data
Data representing measurements that can take any value within a range, such as height or mass.
Symmetry
A property of a distribution whose two sides are mirror images about its centre.
Standard deviation
A measure of how spread out values are around the mean. A larger standard deviation means greater spread.
Variance
A measure of spread equal to the square of the standard deviation: .