

Loading…
Loading…
Loading…
AQA GCSE Statistics · 8382
AQA 8382 · 3.5.19 Check the specification (PDF) (opens in a new tab)
A variable is a quantity that can take different values, such as temperature or the number of cold drinks sold. To investigate a relationship between two variables, we collect paired data: each pair contains two measurements belonging together. For example, we could record the temperature and cold-drink sales on each day.
A scatter diagram displays these pairs. One variable is shown on the horizontal axis and the other on the vertical axis. Each point represents one pair of measurements; the points are not joined together. The overall pattern helps us describe the correlation: how the two numerical variables tend to vary together.
Positive correlation means that as one variable increases, the other tends to increase too. Temperature and cold-drink sales provide an example: warmer days tend to have higher sales. On a scatter diagram, the points form an overall pattern rising from bottom left to top right.
Negative correlation means that as one variable increases, the other tends to decrease. For example, as a car gets older, its value tends to fall. The pattern slopes downwards from top left to bottom right.
Zero correlation, also called no correlation, means there is no apparent upward or downward trend. Knowing the value of one variable does not suggest a consistently higher or lower value of the other. The points look like a scattered cloud rather than following a rising or falling pattern.
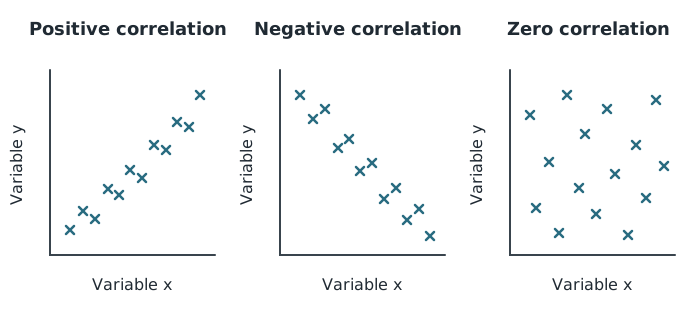
Reading from left to right, the points generally rise, generally fall, or show no apparent trend.
Read each panel from left to right, so that the horizontal variable is increasing. Ask whether the vertical values generally rise, generally fall, or do neither. Describe the overall pattern rather than expecting every point to follow it exactly.
An association is a relationship between variables. When two variables show positive or negative correlation, they are associated. This describes a pattern in the data, but does not by itself explain why the pattern exists.
Causation means that a change in one factor produces a change in another. Establishing a cause-and-effect relationship requires more than observing that two quantities change together. This is the meaning of ‘correlation does not imply causation’.
Imagine recording the height of a growing sunflower and the mass of a growing puppy each day. Both may increase, producing positive correlation. However, making the sunflower taller would not make the puppy heavier. Their growth occurs as time passes: time helps explain why both measurements increase together.
A correlation may therefore reflect a causal relationship, another factor affecting both variables, or a coincidental pattern. The correlation alone cannot tell us which explanation is correct.
When a scatter diagram shows a useful trend, a line of best fit can represent its general direction. We can use this line to estimate one variable from the other. The estimate follows the overall trend rather than any single data point.
Interpolation means estimating within the range of the observed data. For example, suppose computers with prices from £220 to £900 have been tested to record how long they take to complete the same task. Estimating the completion time for a £500 computer is interpolation because £500 lies within that price range. The dataset need not contain a computer costing exactly £500.
To make this estimate on a graph with price on the horizontal axis, start at £500, move vertically to the line of best fit, then horizontally to the time axis. Read the estimated time with its unit.
Extrapolation means estimating outside the range of the observed data. Using the same computer data to estimate the completion time for a £1500 computer would be extrapolation because £1500 is above the highest observed price of £900. Estimating for a price below £220 would also be extrapolation.
Extrapolation assumes that the observed trend continues beyond the data. This makes it generally less reliable than interpolation: more expensive computers might not keep completing the task faster in the same way.
Interpolation is not guaranteed to be accurate either. A sample may be unrepresentative, and individual values may differ from the line of best fit. Both methods produce estimates, not certain outcomes.
An association is a relationship between variables. Causation means that one factor produces a change in another.
Correlation does not imply causation: another factor may affect both variables, or the pattern may be coincidental.
For a line-of-best-fit estimate, move from the known axis value to the line, then across to the other axis. Neither method guarantees an accurate prediction.
Interpret correlation using the names of both variables: ‘As the age of a car increases, its value tends to decrease.’
Use ‘tends to’ rather than claiming that every individual follows the overall pattern.
A correlation alone does not establish causation. Consider whether another factor could explain both changes.
Classify interpolation and extrapolation using the range of the observed data, not the limits printed on the graph axes.
When explaining why extrapolation is less reliable, state that the observed trend may not continue outside the data range.
It can see this note and what your specification asks for.
Answers are free with an account.
1 free note left this week
Get more free notesYour answer sets when this note comes back for review, or marks it complete.
Was this note helpful?
Log in to tell us whether it helped, or to report a problem.
Last updated
Correlation
A pattern describing how two numerical variables tend to vary together.
Positive correlation
A relationship in which higher values of one variable tend to occur with higher values of the other.
Negative correlation
A relationship in which higher values of one variable tend to occur with lower values of the other.
Zero correlation
A pattern showing no apparent upward or downward trend between two numerical variables.
Association
A relationship between variables: their values are connected rather than appearing unrelated.
Causation
A cause-and-effect relationship in which a change in one factor produces a change in another.
Interpolation
Estimating an unknown value within the range of the observed data.
Extrapolation
Estimating an unknown value outside the range of the observed data.
Put your knowledge into practice — try past paper questions for Statistics
Correlation
A pattern describing how two numerical variables tend to vary together.
Positive correlation
A relationship in which higher values of one variable tend to occur with higher values of the other.
Negative correlation
A relationship in which higher values of one variable tend to occur with lower values of the other.
Zero correlation
A pattern showing no apparent upward or downward trend between two numerical variables.
Association
A relationship between variables: their values are connected rather than appearing unrelated.
Causation
A cause-and-effect relationship in which a change in one factor produces a change in another.
Interpolation
Estimating an unknown value within the range of the observed data.
Extrapolation
Estimating an unknown value outside the range of the observed data.