

Loading…
Loading…
Loading…
AQA GCSE Statistics · 8382
AQA 8382 · 3.5.21 Check the specification (PDF) (opens in a new tab)
A describes how two variables tend to vary together. means that changing one variable causes a change in another. These are different claims: observing a pattern does not, by itself, explain what produces it.
For example, suppose you record the height of a growing sunflower and the mass of a growing puppy each day. As the sunflower gets taller, the puppy tends to get heavier. The measurements show positive correlation.
However, this does not establish that making the sunflower taller would make the puppy heavier. Nor does it establish that a heavier puppy makes the sunflower grow. The pattern alone cannot tell us that either variable causes the other.
This is what correlation does not necessarily imply causation means. A causal relationship may exist, but correlation alone is not enough to establish it—even when the pattern is very strong.
In the sunflower and puppy example, the passage of time helps explain the relationship. As time passes, both organisms grow. Their measurements can therefore increase together without either organism's growth causing the other's.
Time is a third factor: something other than the two measured variables that helps explain why they are associated.
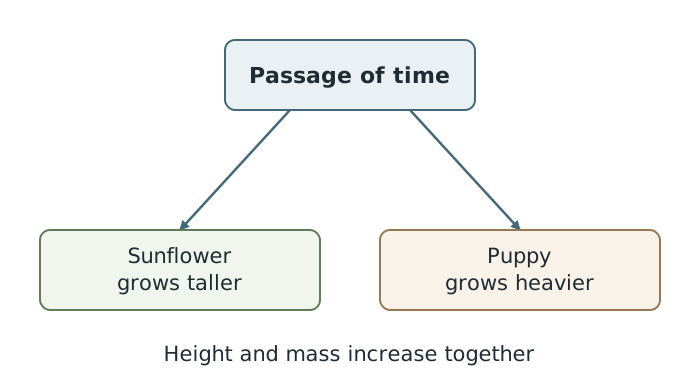
Both measurements can increase as time passes, without one causing the other.
The arrows show two separate influences, not a causal link from sunflower height to puppy mass. When interpreting a correlation, it is useful to ask whether another factor could affect both variables.
A relationship need not have just one simple explanation. Several factors may influence the variables, and their effects may combine or depend on one another.
Consider a study that finds rising atmospheric carbon dioxide levels and rising obesity levels over time. That correlation alone would not establish that carbon dioxide causes obesity. One possible explanation involves increasing wealth: richer populations may have both higher emissions and higher obesity levels.
Here, time and wealth are connected rather than being completely separate explanations. Wealth can change over time and may be associated with changes in both measured quantities. Other influences may also contribute, so it would be unjustified to treat one observed correlation as a complete explanation.
A statistical conclusion should match the evidence. In the sunflower example, you can conclude that greater sunflower height is associated with greater puppy mass in the recorded measurements. You cannot conclude from those measurements alone that increasing sunflower height causes an increase in puppy mass.
Separate what the data show from what might explain the pattern. A plausible third factor is a reason to question a causal claim, not proof that your alternative explanation must be correct.
Several factors may interact to produce a relationship. Consider connected influences rather than assuming one simple cause.
State the association the data support. Distinguish it from a causal claim, and explain how any suggested third factor could affect both variables.
Explain the distinction in context: name the two variables and say why their correlation alone does not show that one causes the other.
If another factor could explain the relationship, name it and explain how it could affect both variables.
Do not replace an unsupported causal claim with its opposite: correlation alone proves neither that causation exists nor that it is impossible.
It can see this note and what your specification asks for.
Answers are free with an account.
1 free note left this week
Get more free notesYour answer sets when this note comes back for review, or marks it complete.
Was this note helpful?
Log in to tell us whether it helped, or to report a problem.
Last updated
Correlation
A pattern of association between two variables, in which their values tend to vary together.
Causation
A relationship in which a change in one variable causes a change in another.
Third factor
An additional variable that may influence both variables being studied, helping to explain their correlation.
Put your knowledge into practice — try past paper questions for Statistics
Correlation
A pattern of association between two variables, in which their values tend to vary together.
Causation
A relationship in which a change in one variable causes a change in another.
Third factor
An additional variable that may influence both variables being studied, helping to explain their correlation.