

Loading…
Loading…
Loading…
AQA GCSE Statistics · 8382
AQA 8382 · 3.5.24 Check the specification (PDF) (opens in a new tab)
A scatter diagram shows paired values of two variables: each point represents one pair. A correlation coefficient summarises an aspect of their relationship using a number between and .
Spearman’s rank correlation coefficient and Pearson’s product moment correlation coefficient answer different questions. Spearman’s looks at the order of the values; Pearson’s looks at how closely the points follow a straight line.
A rank is a value’s position when the values are put in order. Suppose five pupils take two tests. If the pupil with the lowest mark in the first test also has the lowest mark in the second, the next-lowest pupil is also next-lowest, and so on, the two rank orders agree perfectly.
Spearman’s coefficient is then . The gaps between marks do not have to match: it is the pupils’ positions in the two orders that matter.
If the orders are exactly reversed, so that the lowest in one test is the highest in the other and so on, . Values nearer either extreme indicate stronger rank-order correlation.
Pearson’s coefficient uses the numerical values rather than just their ranks. It measures the strength and direction of a linear relationship.
For points lying exactly on an upward-sloping straight line, . For points lying exactly on a downward-sloping straight line, . Values nearer zero indicate weaker linear correlation.
An increasing pattern need not be straight. If one variable keeps increasing as the other increases, but the increases become progressively larger, the points can follow a curve. The rank orders may still agree perfectly even though the relationship is not perfectly linear.
Consider these two constructed sets of paired values. In both, takes the values 1, 2, 3, 4 and 5. In the first, the corresponding values are 1, 2, 3, 4 and 5; in the second, they are 1, 2, 4, 8 and 16.
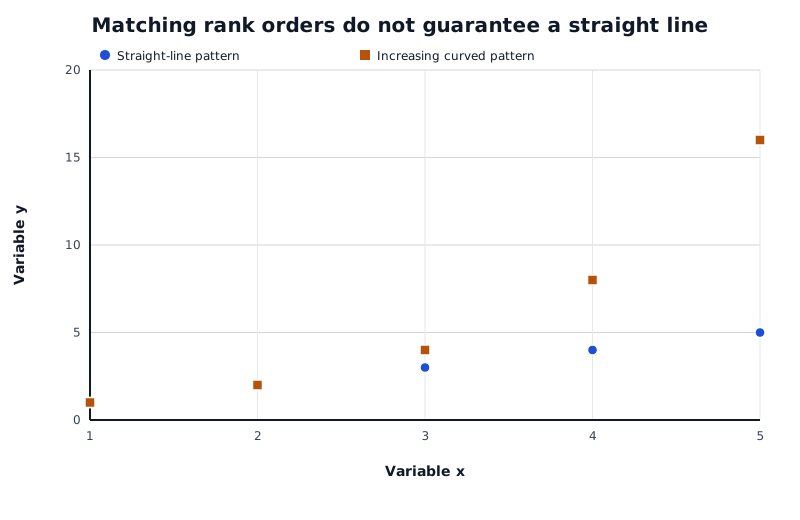
Both sets rise in the same rank order, but only the first set lies on a straight line.
Data for Matching rank orders do not guarantee a straight line
| Series | Variable x | Variable y |
|---|---|---|
| Straight-line pattern | 1 | 1 |
| Straight-line pattern | 2 | 2 |
| Straight-line pattern | 3 | 3 |
| Straight-line pattern | 4 | 4 |
| Straight-line pattern | 5 | 5 |
| Increasing curved pattern | 1 | 1 |
| Increasing curved pattern | 2 | 2 |
| Increasing curved pattern | 3 | 4 |
| Increasing curved pattern | 4 | 8 |
| Increasing curved pattern | 5 | 16 |
Read each set from left to right. Every successive point is higher than the last, so both sets have perfectly matching rank orders: .
The first set also lies exactly on a straight line, so . The second bends upwards, so its Pearson coefficient is positive but less than 1. Perfect rank-order correlation does not guarantee perfect linear correlation.
Spearman’s does not describe every possible curved relationship. For example, a U-shaped pattern first decreases and then increases, so it does not follow one consistent rank order. Both coefficients can be near zero despite a clear curved relationship. Looking at the scatter diagram helps you understand what the coefficient is summarising.
| Coefficient | What it measures |
|---|---|
| Spearman’s, | Correlation of the rank orders |
| Pearson’s, | Strength and direction of a linear relationship |
Both lie between and . The sign indicates direction; closeness to either extreme indicates strength of the relationship being measured.
Matching ranks do not necessarily mean a straight-line relationship.
When comparing the coefficients, explicitly distinguish rank order from a straight-line relationship.
Do not assume that Spearman’s coefficient being 1 means the points lie on a straight line.
Avoid saying that a coefficient near zero proves there is no relationship: a curved pattern may still exist.
It can see this note and what your specification asks for.
Answers are free with an account.
1 free note left this week
Get more free notesYour answer sets when this note comes back for review, or marks it complete.
Was this note helpful?
Log in to tell us whether it helped, or to report a problem.
Last updated
Correlation coefficient
A number between −1 and 1 describing the direction and strength of a particular type of relationship between two variables.
Rank
The position of a value when a set of values is put in order.
Spearman’s rank correlation coefficient
A measure of the correlation between the rank orders of two variables, commonly written as .
Pearson’s product moment correlation coefficient
A measure of the strength and direction of a linear relationship between two variables, commonly written as .
Linear relationship
A relationship represented by a straight-line pattern on a scatter diagram.
Put your knowledge into practice — try past paper questions for Statistics
Correlation coefficient
A number between −1 and 1 describing the direction and strength of a particular type of relationship between two variables.
Rank
The position of a value when a set of values is put in order.
Spearman’s rank correlation coefficient
A measure of the correlation between the rank orders of two variables, commonly written as .
Pearson’s product moment correlation coefficient
A measure of the strength and direction of a linear relationship between two variables, commonly written as .
Linear relationship
A relationship represented by a straight-line pattern on a scatter diagram.