

Loading…
Loading…
Loading…
AQA GCSE Combined Science: Synergy · 8465
AQA 8465 · 4.7.1.10 Check the specification (PDF) (opens in a new tab)
When a driver notices a hazard, such as a pedestrian stepping into the road, the vehicle does not stop immediately. First, the driver must react. Then the brakes slow the vehicle down.
Thinking distance is the distance travelled between noticing the need to stop and applying the brakes. During this reaction time, the vehicle continues moving; it has not yet begun to slow under the braking force.
Braking distance is the distance travelled from applying the brakes until the vehicle comes to rest. Together, these make up the stopping distance:
Both distances matter in an emergency. Even effective brakes cannot remove the distance already travelled while the driver was reacting.
Reaction time is the time between noticing a stimulus and responding. A driver must notice the hazard and respond by applying the brakes. A longer reaction time means that the vehicle travels further before braking begins.
If the vehicle’s speed stays constant during this interval:
Using speed in metres per second and reaction time in seconds gives thinking distance in metres. For example, suppose a car travels at and its driver’s reaction time is . Its thinking distance is . That is ten metres travelled before the brakes are even applied.
At the same reaction time, doubling the speed doubles the thinking distance. This happens because the vehicle covers twice as much ground in each second—not because speed itself makes the driver react more slowly.
Tiredness, alcohol, certain drugs and distractions can increase reaction time. A distraction such as looking at a mobile phone can delay noticing a hazard or responding to it. These factors therefore increase thinking distance at a given speed.
Suppose reaction-time measurements for two conditions give means of when alert and when distracted. At a speed of , the corresponding thinking distances would be and . The longer reaction time adds six metres before braking starts, even if the brakes work equally well in both conditions.
When evaluating results like these, compare measurements at the same vehicle speed. Look for repeated measurements, variation between results and whether other conditions were controlled. A difference between two individual drivers might reflect their usual reaction times rather than the factor being investigated. Repeated comparisons with the same participants provide stronger evidence, although practice could also improve their performance.
The safety implication is clear: a driver needs to be alert and attentive. Better brakes do not compensate for delayed reactions.
Braking distance depends on how much kinetic energy must be transferred and how effectively the vehicle can brake.
Higher speed: for a given braking force, a faster vehicle takes a greater distance to stop. Its kinetic energy is greater, so the braking force must do more work to bring it to rest. Since kinetic energy depends on speed squared, doubling speed gives four times the kinetic energy for the same vehicle. With the same braking force, the braking distance is therefore four times as great.
Wet or icy roads: these reduce friction between the tyres and the road. There is less grip available to slow the vehicle, so braking distance increases. Ice is especially dangerous because grip can be very low.
Poor tyre condition: worn tyres provide less effective grip, particularly on wet roads. This reduces the force available to slow the vehicle and increases braking distance.
Poor brake condition: worn or faulty brakes may produce a smaller braking force. The vehicle then decelerates less strongly and travels further before stopping.
These distinctions help explain a particular situation. If an alert driver brakes promptly but the vehicle continues sliding on ice, the main problem is braking distance, not thinking distance. If the driver is distracted, extra distance is travelled before the brakes are applied.
A moving vehicle has a kinetic energy store. Applying the brakes produces friction between the braking surfaces connected to the wheels. This friction force does work as the vehicle slows.
The vehicle’s kinetic energy decreases, while the thermal energy store of the brakes increases and their temperature rises. Energy is subsequently transferred from the hot brakes to the surroundings. Energy has not disappeared; it has been transferred and spread into the surroundings.
To stop a faster vehicle within the same braking distance, a greater braking force is needed: more kinetic energy must be transferred over that distance.
For the same vehicle mass, a greater braking force produces a greater deceleration. However, very large decelerations can cause problems.
The brakes may have to transfer a large amount of energy in a short time, causing them to overheat. Overheated brakes can become less effective, making further braking more difficult.
A large braking force may also exceed the grip available between the tyres and the road. The wheels can lock and the vehicle may skid, leading to loss of control. This is especially dangerous on wet or icy surfaces.
Drivers should therefore reduce speed and leave sufficient space rather than rely on sudden, severe braking. Larger gaps are needed when grip is poor. Maintaining brakes and tyres, avoiding distractions and not driving when impaired all reduce the risk of being unable to stop in time.
A graph can compare how stopping distance changes with speed for different vehicles. Read the horizontal axis, vertical axis, units and key before comparing the curves.
The constructed example below compares a car and a loaded van under chosen conditions. It demonstrates how to read such a graph; it does not predict stopping distances for particular road vehicles.
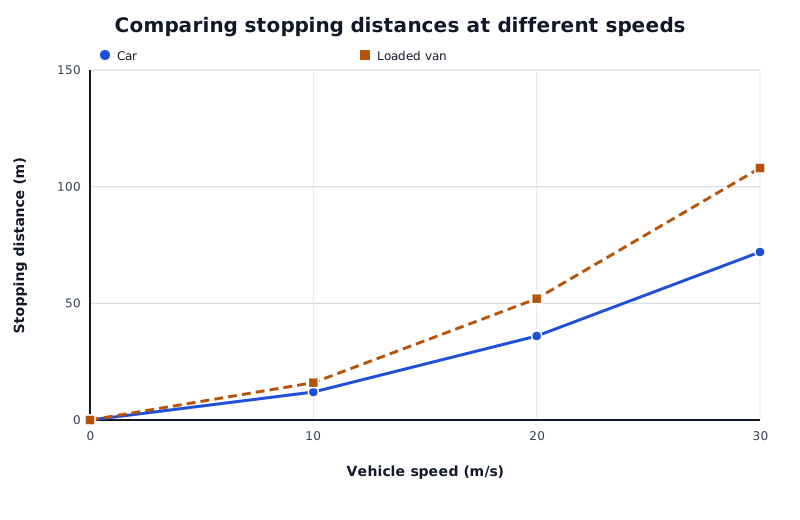
Constructed comparison: read both curves at the same speed. These chosen distances demonstrate graph interpretation, not predictions for specific vehicles.
Data for Comparing stopping distances at different speeds
| Series | Vehicle speed (m/s) | Stopping distance (m) |
|---|---|---|
| Car | 0 | 0 |
| Car | 10 | 12 |
| Car | 20 | 36 |
| Car | 30 | 72 |
| Loaded van | 0 | 0 |
| Loaded van | 10 | 16 |
| Loaded van | 20 | 52 |
| Loaded van | 30 | 108 |
To compare the vehicles at , move vertically from that speed to each curve, then horizontally to the distance axis. The car’s stopping distance is and the loaded van’s is : a difference of .
Both curves become steeper as speed increases. Equal increases in speed therefore add progressively more stopping distance. Do not assume that doubling speed simply doubles stopping distance: thinking distance and braking distance respond differently to speed.
A higher curve means a longer stopping distance at the same speed. The graph alone does not establish why. Greater mass means more kinetic energy at the same speed, but differences in braking force, tyres, road conditions or reaction time could also matter. Check the stated conditions before explaining a difference between vehicles.
A braking-force estimate can be made from the vehicle’s mass and deceleration:
Here, is the resultant force in newtons, is mass in kilograms and is acceleration in . For braking, the force acts opposite to the direction of motion.
Suppose a car has a mass of and slows uniformly from to rest in a braking time of . Its deceleration has a magnitude of . The resultant force has a magnitude of , or .
If braking provides most of the resultant force, this estimates the braking force. The estimate assumes uniform deceleration and neglects other contributions such as air resistance. It uses the time spent slowing down, not the reaction time before braking.
Identify whether a factor changes reaction time, braking force or both parts of stopping distance.
Tiredness increases reaction time: the driver takes longer to respond, not less time.
When comparing graph curves, read distances at the same speed and check whether they show stopping distance or just braking distance.
Explain braking using an energy transfer: kinetic energy decreases and the thermal energy store of the brakes increases.
In Higher Tier force estimates, convert speeds to m/s and distinguish the braking time from the driver’s reaction time.
It can see this note and what your specification asks for.
Answers are free with an account.
1 free note left this week
Get more free notesYour answer sets when this note comes back for review, or marks it complete.
Was this note helpful?
Log in to tell us whether it helped, or to report a problem.
Last updated
Stopping distance
The total distance a vehicle travels from the driver first noticing the need to stop until the vehicle comes to rest; thinking distance plus braking distance.
Thinking distance
The distance a vehicle travels during the driver’s reaction time, before the brakes are applied.
Braking distance
The distance a vehicle travels from when the brakes are applied until it comes to rest.
Reaction time
The time between noticing a stimulus, such as a road hazard, and responding to it.
Braking force
A force acting against a vehicle’s motion when its brakes are applied.
Deceleration
A decrease in speed per unit time, measured in metres per second squared, .
Work done
Energy transferred when a force moves an object through a distance, measured in joules (J).
Put your knowledge into practice — try past paper questions for Combined Science: Synergy
Stopping distance
The total distance a vehicle travels from the driver first noticing the need to stop until the vehicle comes to rest; thinking distance plus braking distance.
Thinking distance
The distance a vehicle travels during the driver’s reaction time, before the brakes are applied.
Braking distance
The distance a vehicle travels from when the brakes are applied until it comes to rest.
Reaction time
The time between noticing a stimulus, such as a road hazard, and responding to it.
Braking force
A force acting against a vehicle’s motion when its brakes are applied.
Deceleration
A decrease in speed per unit time, measured in metres per second squared, .
Work done
Energy transferred when a force moves an object through a distance, measured in joules (J).
Friction does work: the vehicle’s kinetic energy decreases, the brakes’ thermal energy store increases and their temperature rises.
Compare graph distances at the same speed. Check the key and whether the graph shows thinking, braking or total stopping distance. A steeper curve means distance increases more rapidly with speed.
For reaction-time data, compare means, variation, repeats and controlled conditions before drawing a conclusion.
Estimate deceleration from speed lost divided by braking time. Use kg, m/s and s; the force acts against the motion.