Loading…


Loading…
Loading…
Loading…
AQA GCSE Business · 8132
AQA 8132 · Financial Terms and Break-even Check the specification (PDF) (opens in a new tab)
A business incurs costs when it produces and sells goods or services. A bakery, for example, pays for ingredients, premises and staff. Understanding how these expenses behave helps its owner judge whether selling more products will be worthwhile.
Output is the quantity produced during a particular period. Fixed costs do not change as output changes over the period and range being considered. A bakery normally pays the same rent whether it produces very few cakes or many cakes. Insurance and management salaries are other examples. Fixed does not mean that a cost can never change: rent might rise when a lease is renewed.
Variable costs change with output. Producing more cakes requires more flour, eggs and packaging, so the bakery's total variable costs rise. Pay linked directly to the number of items produced can also be variable. The important distinction is how the cost behaves, rather than simply whether it is a payment to a worker or supplier.
If variable cost per unit stays constant:
Total costs include both types of cost:
At zero output, variable costs are zero in this simple model, but fixed costs still have to be paid. Total costs therefore start above zero.
Revenue is the income a business earns from sales, before deducting its costs. For a product sold at one price:
Producing a cake does not itself earn revenue: the cake must be sold. At an unchanged selling price, selling more cakes increases revenue.
Profit is what remains when revenue exceeds total costs:
If total costs exceed revenue, the business makes a loss. High sales revenue does not necessarily mean high profit: the business might also have very high costs. Figures must relate to the same period when making this comparison.
Profit rewards entrepreneurs and investors for taking risks and can help fund business growth. A business can improve profit by increasing revenue, reducing costs, or doing both. However, decisions are connected: cutting ingredient quality might reduce costs but also discourage customers from buying.
Break-even output is the output level at which total revenue equals total costs. All costs are covered, but there is neither a profit nor a loss.
A break-even chart puts output on the horizontal axis and money on the vertical axis. Its revenue and cost lines allow you to compare the financial position at different output levels.
The chart below is a weekly bakery example. It assumes fixed costs of £100 per week, variable costs of £2 per cake and a selling price of £4 per cake. It also assumes that every cake produced is sold.
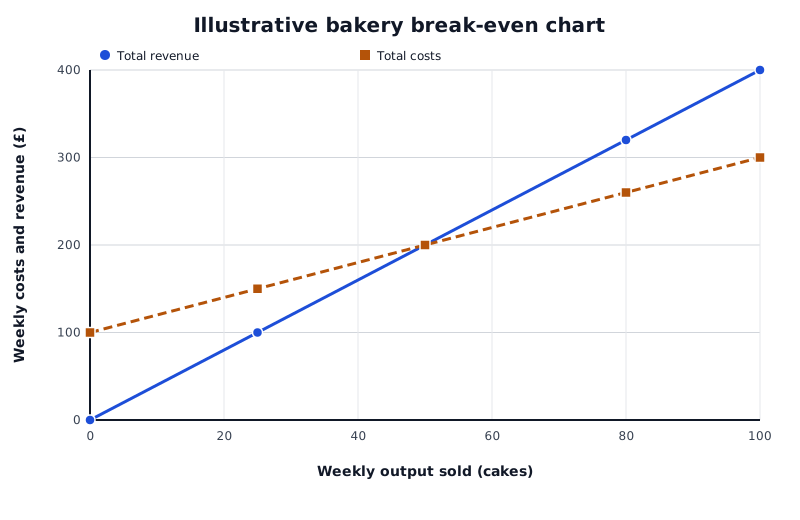
A weekly bakery model, assuming every cake produced is sold. The lines cross at 50 cakes; compare their heights at 80 cakes to read profit.
Data for Illustrative bakery break-even chart
| Series | Weekly output sold (cakes) | Weekly costs and revenue (£) |
|---|---|---|
| Total revenue | 0 | 0 |
| Total revenue | 25 | 100 |
| Total revenue | 50 | 200 |
| Total revenue | 80 | 320 |
| Total revenue | 100 | 400 |
| Total costs | 0 | 100 |
| Total costs | 25 | 150 |
| Total costs | 50 | 200 |
| Total costs | 80 | 260 |
| Total costs | 100 | 300 |
The revenue line begins at the origin: selling no cakes earns no revenue. It slopes upwards because more sales bring in more money.
The total costs line starts at £100 on the vertical axis. This starting value represents fixed costs. It rises as output increases because producing additional cakes adds variable costs. If fixed costs were shown as a separate line, that line would be horizontal at £100.
To identify break-even, find where the revenue and total costs lines cross. Then read vertically down to the output axis. Here they cross at 50 cakes, where both revenue and total costs are £200. The break-even output is therefore 50 cakes, not £200.
Below 50 cakes, total costs are above revenue, so the bakery makes a loss. Above 50 cakes, revenue is above total costs, so it makes a profit. This interpretation depends on the prices, costs and sales assumptions used in the chart.
To read profit or loss at a particular output, move vertically upwards from that output and read the values on both lines. The vertical gap between them is the profit or loss in pounds.
At 80 cakes, the chart shows revenue of £320 and total costs of £260. Subtracting total costs from revenue gives a weekly profit of £60. At 25 cakes, revenue is £100 but total costs are £150, so the weekly loss is £50.
The margin of safety shows how far sales can fall before the business reaches break-even. Read the actual or planned output and the break-even output from the horizontal axis, then find the difference:
If the bakery sells 80 cakes, its margin of safety is 80 minus 50, or 30 cakes. Sales could fall by 30 cakes before it reaches break-even; a further fall would lead to a loss under the same assumptions.
Unlike profit, margin of safety is a horizontal difference measured in units, not a vertical difference measured in money. A larger positive margin generally provides more protection against falling sales.
Break-even analysis gives a business a clear sales target for covering its costs. The bakery owner can compare the target of 50 cakes with expected customer demand and use it to plan production. Marketing decisions affect whether enough customers buy, while production decisions affect whether the bakery can supply that quantity.
It also supports ‘what if?’ analysis. Higher fixed costs, such as higher rent, would raise the total costs line and increase the output needed to break even. A higher selling price could reduce break-even output if costs stayed unchanged. This helps the owner compare possible decisions before committing to them.
However, a chart is not a sales forecast. Knowing that the bakery needs to sell 50 cakes does not show that customers will buy them. A price increase might improve revenue per cake but reduce demand.
The simple chart also assumes that all output is sold and that selling price and variable cost per unit remain constant. Unsold cakes, ingredient price rises or discounts would make its predictions less reliable. Businesses selling many products at different prices and costs face a more complicated analysis.
Its usefulness therefore depends on the accuracy of the data and how realistic the assumptions are. Break-even analysis can be valuable for a bakery with predictable costs and a simple product range, but the owner should also consider demand, competition and product quality. It supports a decision; it does not guarantee that the decision will succeed.
Get unlimited access to all revision notes, key terms, and exam tips.
Fixed costs stay unchanged as output changes within the relevant period and range. Variable costs change with output.
Useful for: setting sales targets, planning production, assessing sales risk and comparing changes in prices or costs.
Limited by: inaccurate estimates, changing prices or costs, unsold output and complicated product ranges. It does not predict demand.
Judgement: use break-even analysis alongside evidence about customers, competitors and business conditions.
Get unlimited access to all revision notes, key terms, and exam tips.
Read the axis scales carefully. Break-even output and margin of safety are measured in units of output, whereas revenue, costs and profit are measured in money.
Find break-even where revenue crosses total costs, not where revenue crosses fixed costs.
When reading profit or loss, compare revenue and total costs at the same output level.
Support an evaluation with the business context: explain why a particular benefit or limitation matters before reaching a judgement.
For AQA GCSE Business, you are not expected to draw break-even charts or use the break-even formula.
Output
The number of goods or services a business produces in a given period.
Cost
An expense incurred by a business in producing and selling goods or services.
Fixed cost
A cost that does not change as output changes over the period and range of output being considered, such as rent.
Variable cost
A cost that changes with output, such as the total cost of raw materials used in production.
Total cost
The sum of fixed costs and total variable costs at a particular output level.
Revenue
Income earned from selling goods or services, calculated as selling price multiplied by quantity sold.
Profit
The surplus remaining when revenue exceeds total costs.
Loss
The amount by which total costs exceed revenue.
Break-even output
The level of output at which total revenue equals total costs, so the business makes neither a profit nor a loss.
Margin of safety
The difference between actual or planned sales output and break-even output; it shows how far sales can fall before the business begins making a loss.
Break-even analysis
Using costs and revenue at different output levels to identify break-even and help assess business decisions.
Put your knowledge into practice — try past paper questions for Business
Output
The number of goods or services a business produces in a given period.
Cost
An expense incurred by a business in producing and selling goods or services.
Fixed cost
A cost that does not change as output changes over the period and range of output being considered, such as rent.
Variable cost
A cost that changes with output, such as the total cost of raw materials used in production.
Total cost
The sum of fixed costs and total variable costs at a particular output level.
Revenue
Income earned from selling goods or services, calculated as selling price multiplied by quantity sold.
Profit
The surplus remaining when revenue exceeds total costs.
Loss
The amount by which total costs exceed revenue.
Break-even output
The level of output at which total revenue equals total costs, so the business makes neither a profit nor a loss.
Margin of safety
The difference between actual or planned sales output and break-even output; it shows how far sales can fall before the business begins making a loss.
Break-even analysis
Using costs and revenue at different output levels to identify break-even and help assess business decisions.